Visualization and 3D Export

Visualization and 3D Export

SeeSAR’s visualization is tailored to support you in your understanding of a ligand-target complex and your molecular ideas. Color-coding and quantitative representations of individual atom contributions related to the overall binding affinity allow easy visual processing. Visual clues provide ideas on compound improvement and point to regions where attention should be paid. We don't leave you with a pile of numbers. Instead, meaningful visualization makes you stay in the driver's seat and take "visually informed" decisions.

Assessment of the Target-Ligand Complex

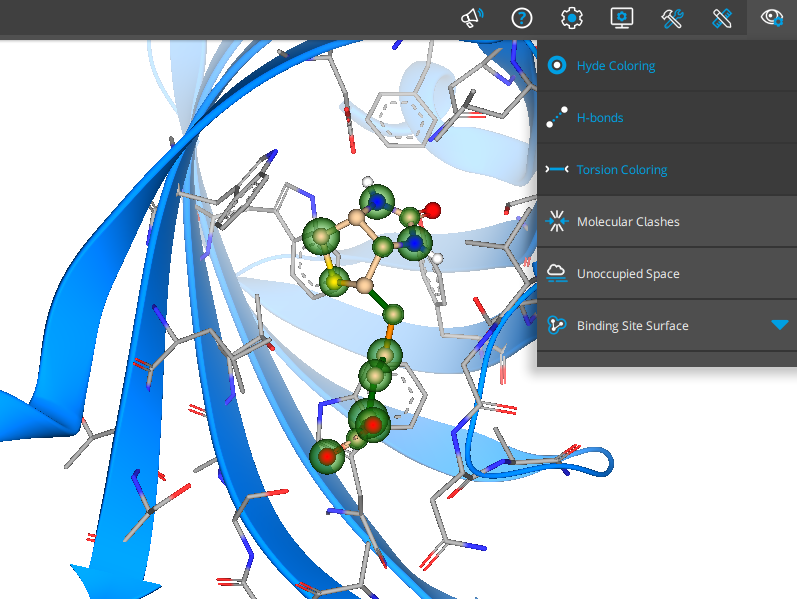
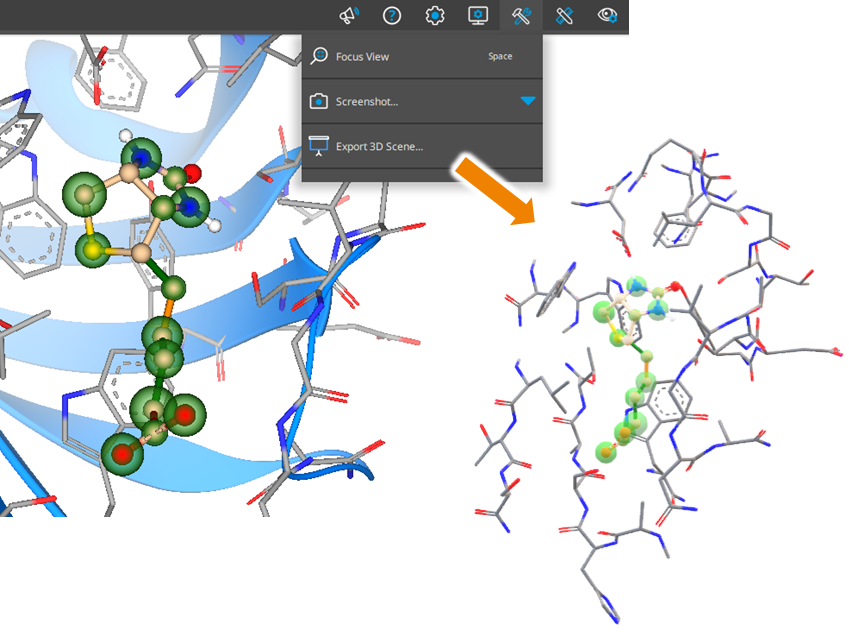
Go to ‘Visualization’ to turn on properties you want to be displayed on your complex in the 3D window.
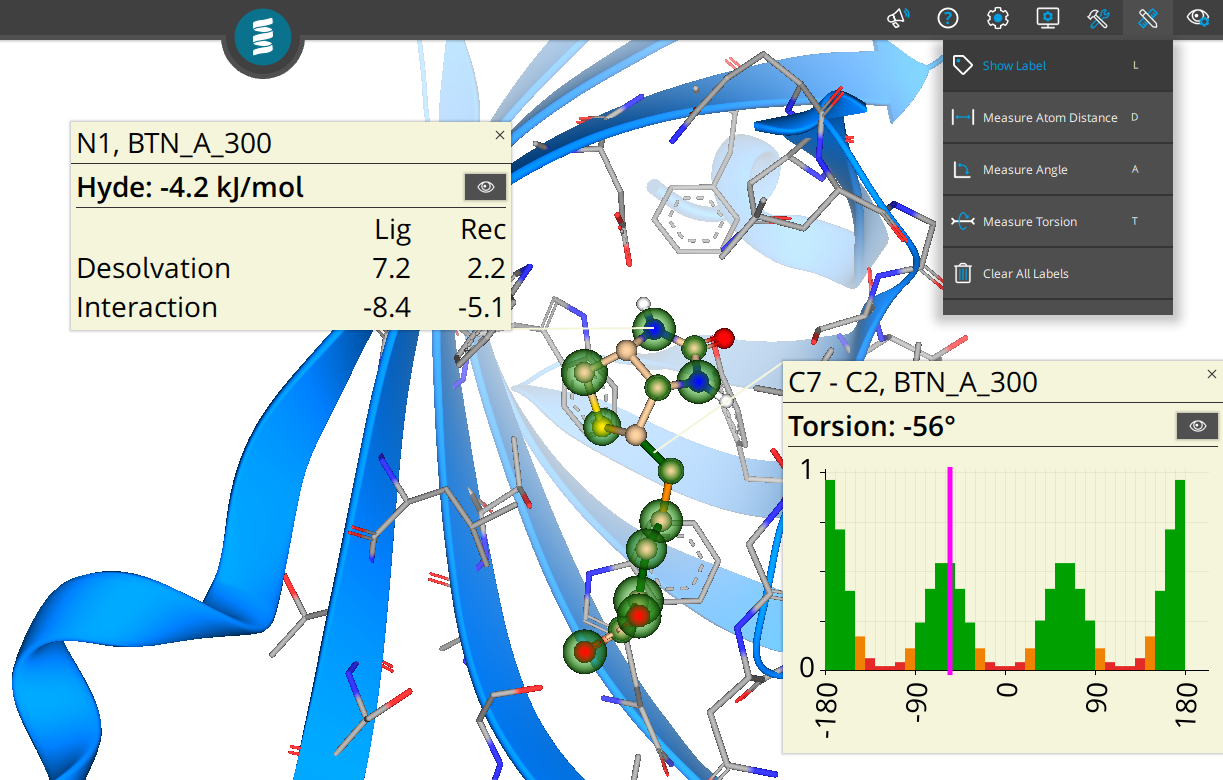
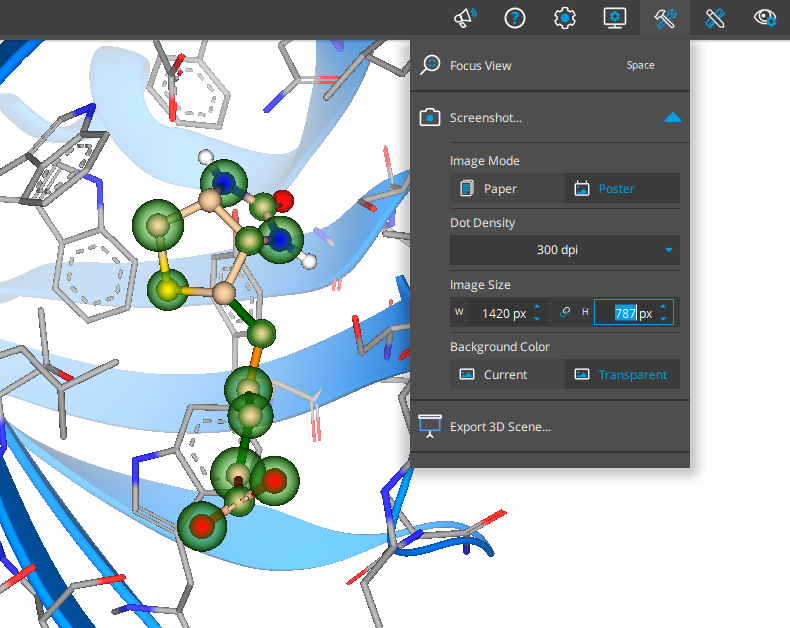
  • Hyde: Green spheres indicate affinity gain by forming the complex. Red spheres indicate an affinity loss. The sphere’s sizes correlate with the free energy contribution of the atom and its receptor environment.
  • Torsions: Green represents very common torsion geometries, orange represent bonds where caution is required, and red represents unusual or very rarely occurring torsional geometries. Note that the colors make a statistical statement, not necessarily an energetic one.
  • Clashes: Indicate (potential) overlaps of the ligand with the target structure’s surface area.

Helpful Insights

You can see additional information on the individual Hyde affinity estimations and the torsions by labeling atoms or bonds. To do so, go to ‘Label and measure’ and select ‘Show Label’ — or simply use the hotkey L to tag items of interest. If successful, estimated hydration bond and dehydration energies of both ligand and target as well as torsion histograms will be displayed.

High-Quality Illustration

Further you have the possibility to use SeeSAR to export high-quality figures for publications, posters, and presentations. Under ‘Utilities’ and ‘Screenshot’, you can select the desired dpi value for the image. The ‘Poster’ features provides you with the possibility to adjust your image size. Labels are automatically cleaned up.

Using 3D Models in PowerPoint

Make live demos from within PowerPoint! SeeSAR can now create generic 3D models as so-called "glb" files that can be used in external applications. You can include them, for example, in your PowerPoint presentations or use them in Microsoft Teams to discuss the next steps live with your colleagues, or even include them on your company’s website through WordPress. It's very easy: Export a 3D model under ‘Utilities’, and select ‘Export 3D scene’. Drag and drop the file onto a PowerPoint slide. Done. In presentation mode, you can animate your models, for example by giving them a spin. Outside presentation mode, you have full 3D control over your model.

Upcoming 3D Export Features: Tertiary Target Structure and Surfaces

The next SeeSAR update will include a revamp of the visualization software architecture. This comes with some additional perks: 3D export will support the representation of the binding site surface and the tertiary structure of the target. Both features will boost the way you communicate suggestions to your team, visualize potential unoccupied subpockets, elucidate differences in binding sites in a group of targets, and much more.

Download SeeSAR, and create gorgeous figures!